uniAPP·使用uCharts实现统计图表 复制官方代码直接显示(原生模式)
前提:
1.下载好uCharts官网的 u-charts.js 文本 (地址)
https://gitee.com/uCharts/uCharts/tree/master/uni-app/uCharts-%E5%8E%9F%E7%94%9F
2.去uCharts官网的号航上“原生工具” (地址);现在好需要的图表和相关需求配置后点击右侧“查看全部代码” 然后直接复制代码
https://www.ucharts.cn/v2/#/doc/index

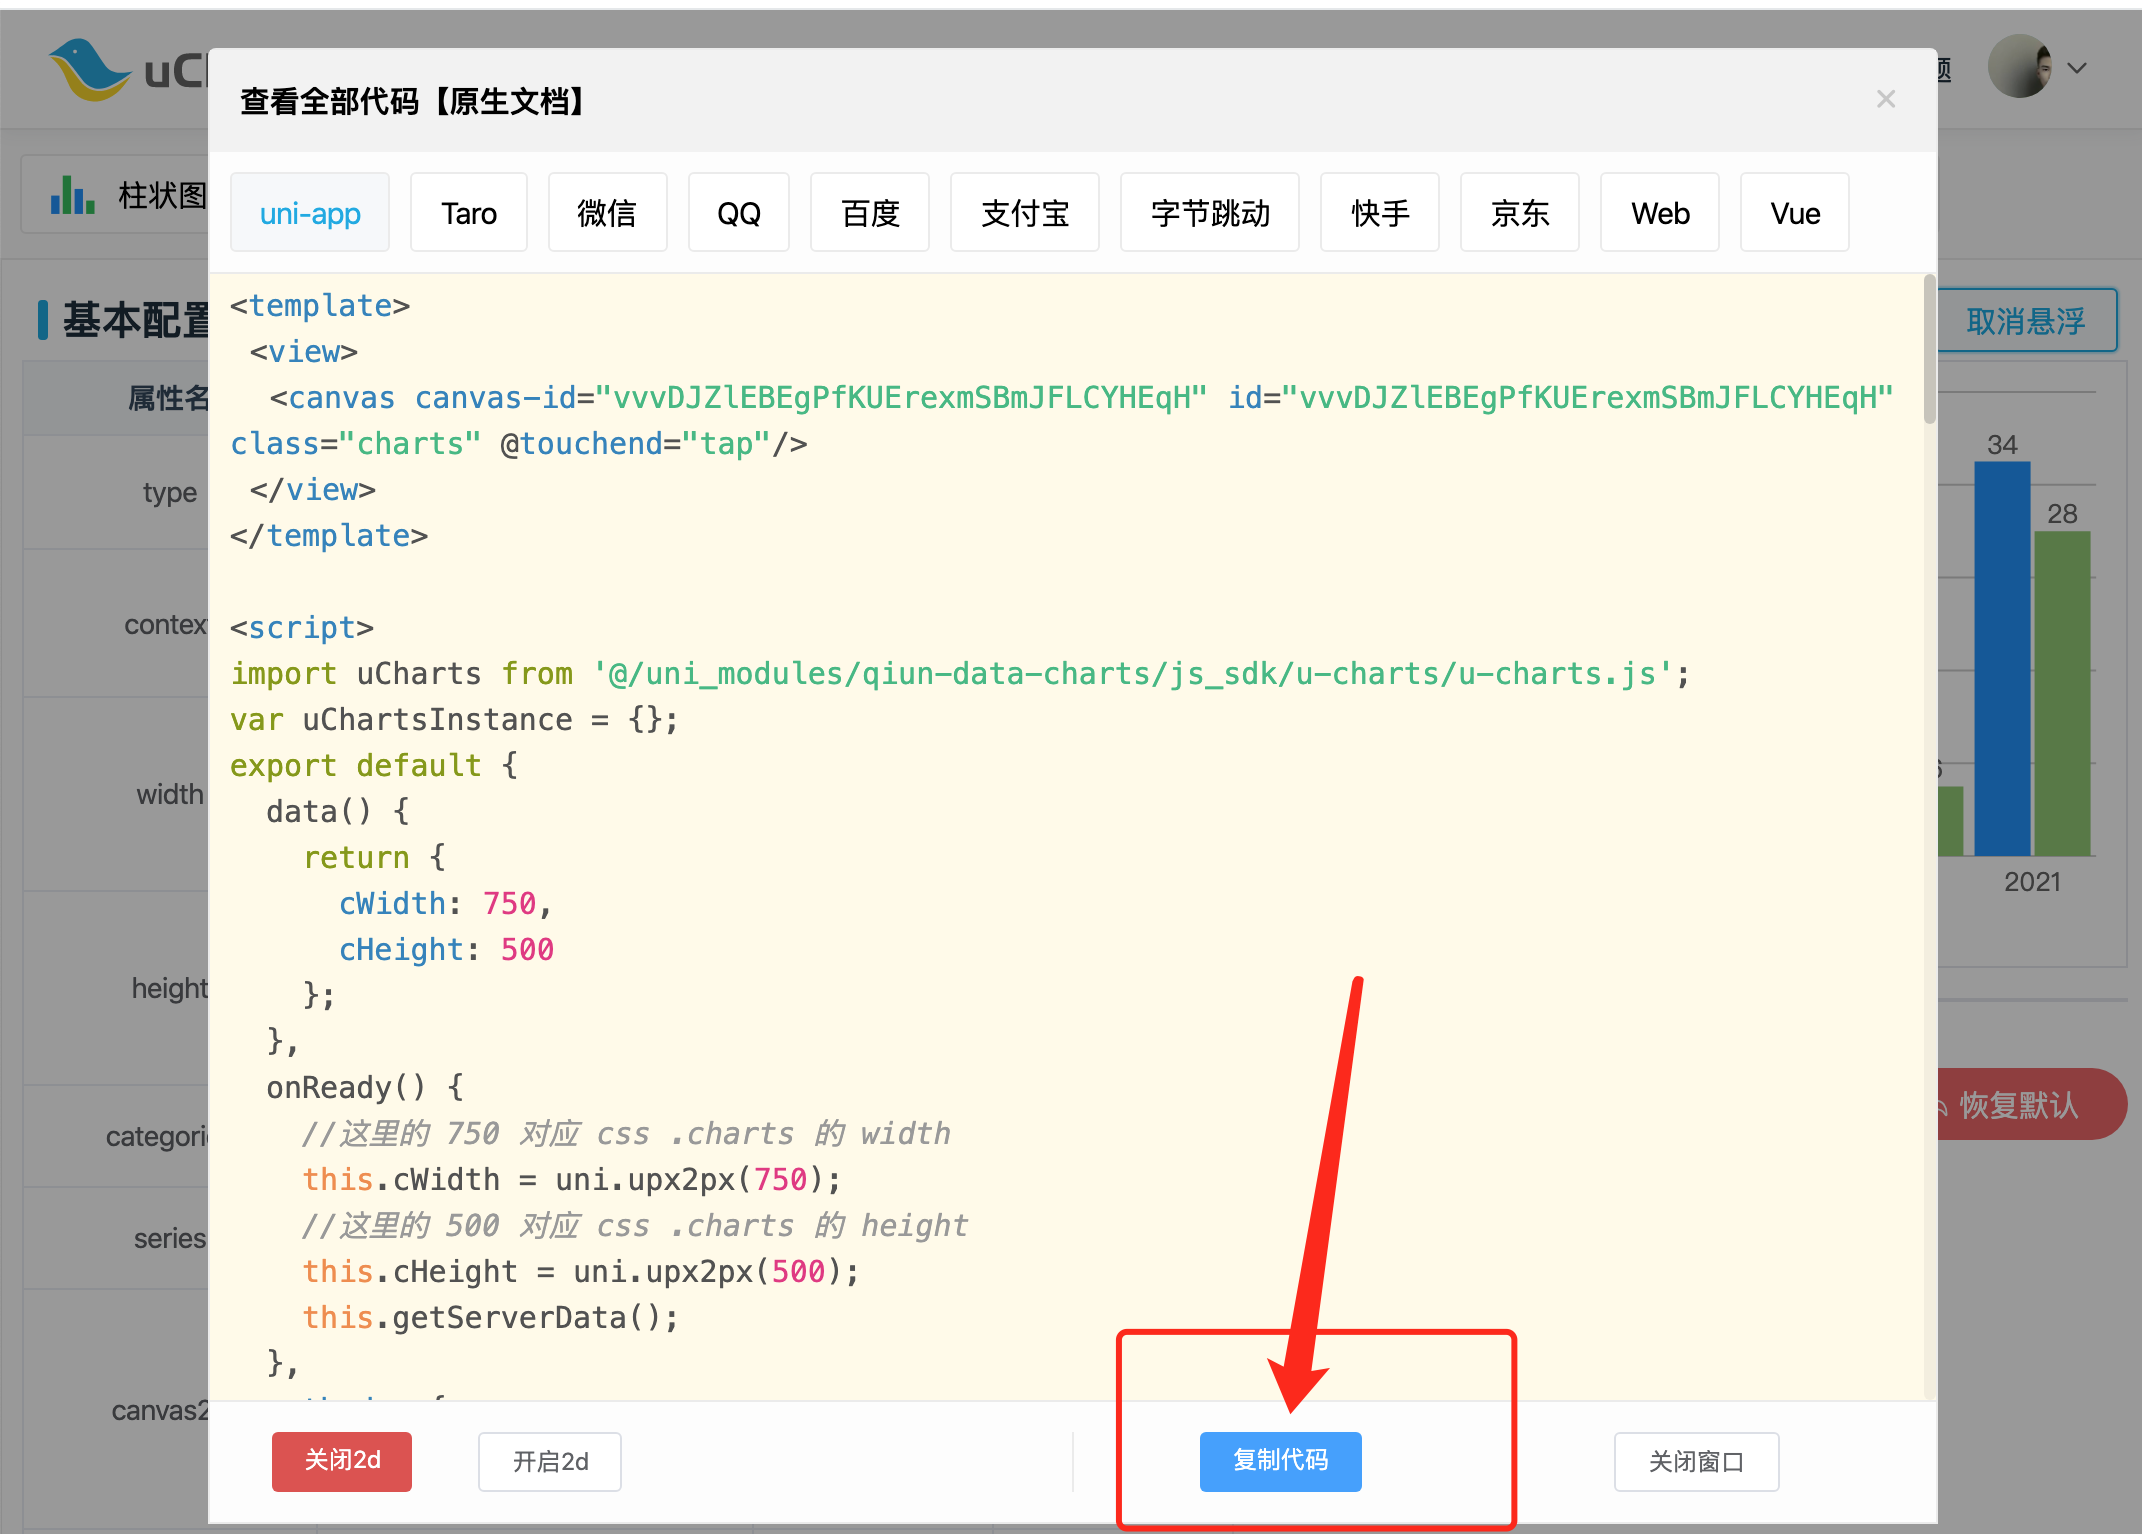
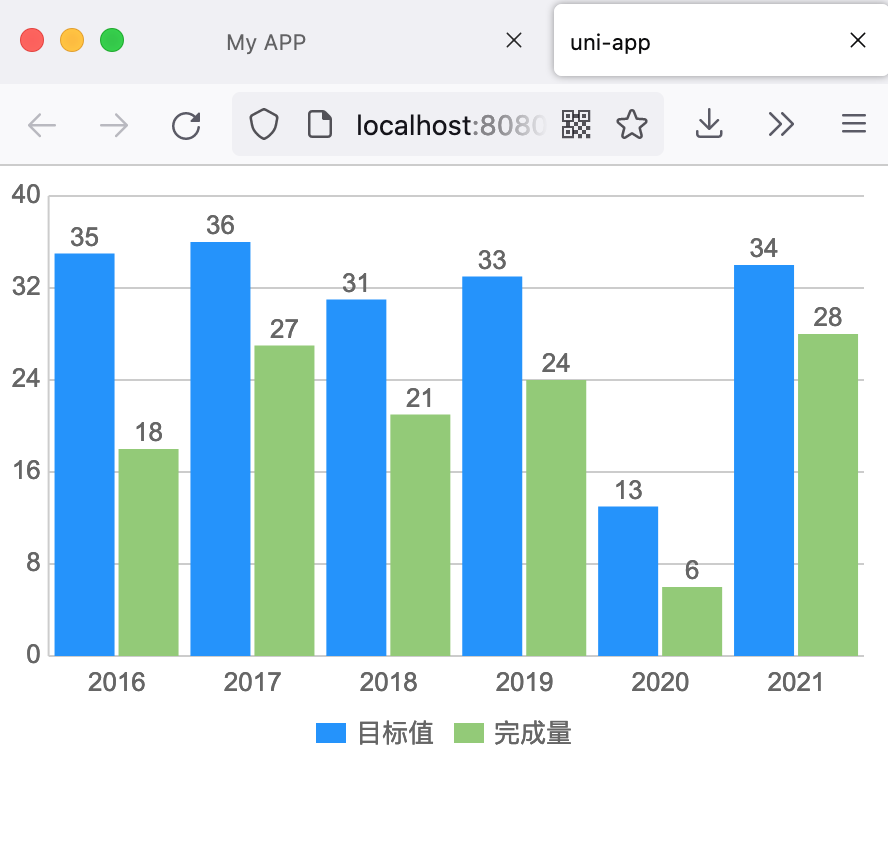
0【效果图】
1【view】把复制好的代码全页面粘贴
柱状统计图 页面代码
<template>
<view>
<canvas canvas-id="PrXJpHQibjLQlkYMvKmNmOYeUnzhwGlM" id="PrXJpHQibjLQlkYMvKmNmOYeUnzhwGlM" class="charts" @touchend="tap"/>
</view>
</template>
<script>
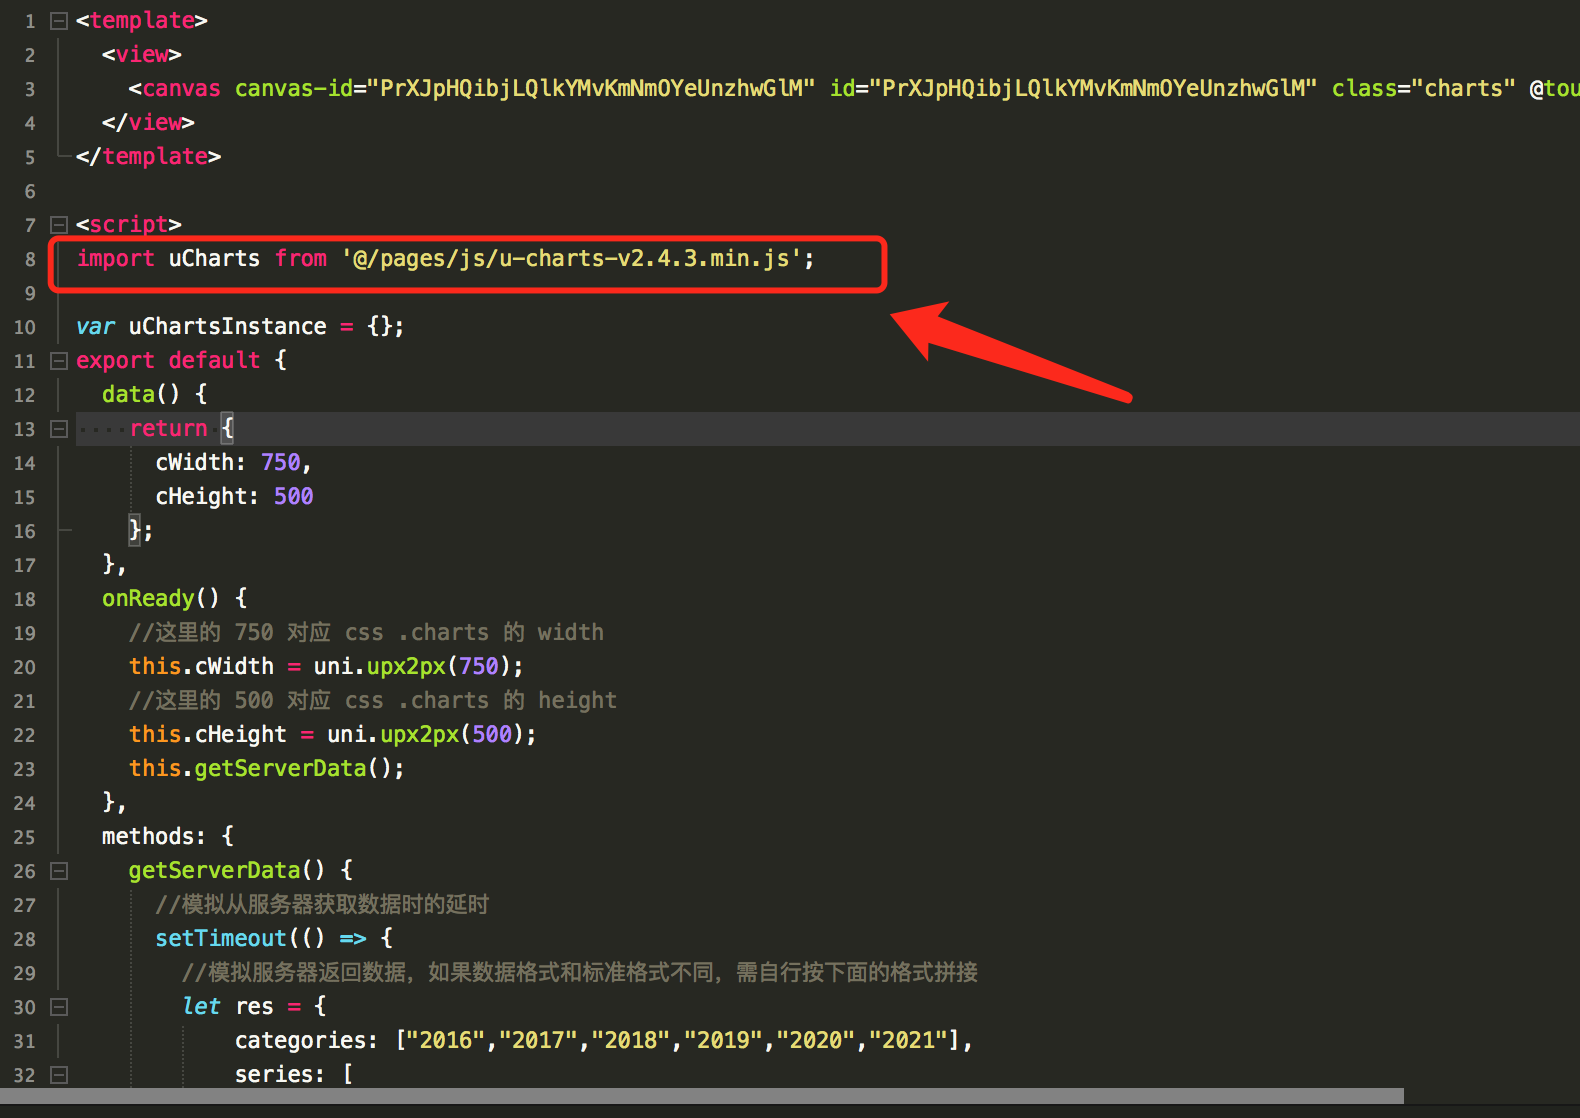
import uCharts from '@/pages/js/u-charts-v2.4.3.min.js';
var uChartsInstance = {};
export default {
data() {
return {
cWidth: 750,
cHeight: 500
};
},
onReady() {
//这里的 750 对应 css .charts 的 width
this.cWidth = uni.upx2px(750);
//这里的 500 对应 css .charts 的 height
this.cHeight = uni.upx2px(500);
this.getServerData();
},
methods: {
getServerData() {
//模拟从服务器获取数据时的延时
setTimeout(() => {
//模拟服务器返回数据,如果数据格式和标准格式不同,需自行按下面的格式拼接
let res = {
categories: ["2016","2017","2018","2019","2020","2021"],
series: [
{
name: "目标值",
data: [35,36,31,33,13,34]
},
{
name: "完成量",
data: [18,27,21,24,6,28]
}
]
};
this.drawCharts('PrXJpHQibjLQlkYMvKmNmOYeUnzhwGlM', res);
}, 500);
},
drawCharts(id,data){
const ctx = uni.createCanvasContext(id, this);
uChartsInstance[id] = new uCharts({
type: "column",
context: ctx,
width: this.cWidth,
height: this.cHeight,
categories: data.categories,
series: data.series,
animation: true,
timing: "easeOut",
duration: 1000,
rotate: false,
rotateLock: false,
background: "#FFFFFF",
color: ["#1890FF","#91CB74","#FAC858","#EE6666","#73C0DE","#3CA272","#FC8452","#9A60B4","#ea7ccc"],
padding: [15,15,0,5],
fontSize: 13,
fontColor: "#666666",
dataLabel: true,
dataPointShape: true,
dataPointShapeType: "solid",
touchMoveLimit: 60,
enableScroll: false,
enableMarkLine: false,
legend: {
show: true,
position: "bottom",
float: "center",
padding: 5,
margin: 5,
backgroundColor: "rgba(0,0,0,0)",
borderColor: "rgba(0,0,0,0)",
borderWidth: 0,
fontSize: 13,
fontColor: "#666666",
lineHeight: 11,
hiddenColor: "#CECECE",
itemGap: 10
},
xAxis: {
disableGrid: true,
disabled: false,
axisLine: true,
axisLineColor: "#CCCCCC",
calibration: false,
fontColor: "#666666",
fontSize: 13,
rotateLabel: false,
rotateAngle: 45,
itemCount: 5,
boundaryGap: "center",
splitNumber: 5,
gridColor: "#CCCCCC",
gridType: "solid",
dashLength: 4,
gridEval: 1,
scrollShow: false,
scrollAlign: "left",
scrollColor: "#A6A6A6",
scrollBackgroundColor: "#EFEBEF",
formatter: ""
},
yAxis: {
data: [
{
min: 0
}
],
disabled: false,
disableGrid: false,
splitNumber: 5,
gridType: "solid",
dashLength: 8,
gridColor: "#CCCCCC",
padding: 10,
showTitle: false
},
extra: {
column: {
type: "group",
width: 30,
activeBgColor: "#000000",
activeBgOpacity: 0.08,
seriesGap: 2,
categoryGap: 3,
barBorderCircle: false,
linearType: "none",
linearOpacity: 1,
colorStop: 0,
meterBorder: 1,
meterFillColor: "#FFFFFF"
},
tooltip: {
showBox: true,
showArrow: true,
showCategory: false,
borderWidth: 0,
borderRadius: 0,
borderColor: "#000000",
borderOpacity: 0.7,
bgColor: "#000000",
bgOpacity: 0.7,
gridType: "solid",
dashLength: 4,
gridColor: "#CCCCCC",
fontColor: "#FFFFFF",
splitLine: true,
horizentalLine: false,
xAxisLabel: false,
yAxisLabel: false,
labelBgColor: "#FFFFFF",
labelBgOpacity: 0.7,
labelFontColor: "#666666"
},
markLine: {
type: "solid",
dashLength: 4,
data: []
}
}
});
},
tap(e){
uChartsInstance[e.target.id].touchLegend(e);
uChartsInstance[e.target.id].showToolTip(e);
}
}
};
</script>
<style scoped>
.charts{
width: 750rpx;
height: 500rpx;
}
</style>2【js】修改原代码的js文件路径,改为你下载好后导入的 u-charts.js 文件路径
3【显示】运行代码到浏览器显示ok
1,070 Views
