Vue3 统计图表 Apex Charts使用方式
官方文档地址:https://apexcharts.com/docs/vue-charts/
官方示例地址:https://apexcharts.com/vue-chart-demos/
- 准备 手脚架
项目终端下加载:
npm install --save apexcharts
npm install --save vue3-apexcharts
- 所需项目vue页面引入文件
import apexchart from 'vue3-apexcharts'
- 统计图完整示例
<template>
<div class="chartsview_box" id="chart">
<apexchart width="500" type="bar" :options="options" :series="series"></apexchart>
</div>
</template>
<script setup>
import {
ref
} from 'vue';
import apexchart from 'vue3-apexcharts'
//数据
let options = {
chart: {
id: 'vuechart-example'
},
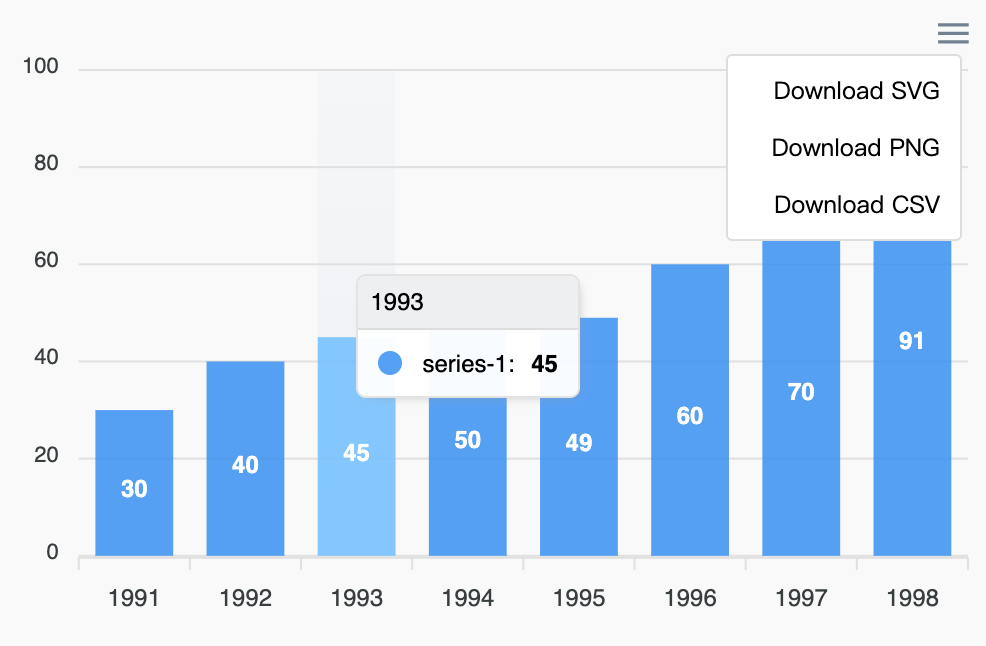
xaxis: {
categories: [1991, 1992, 1993, 1994, 1995, 1996, 1997, 1998]
},
colors: ['#1ab7ea', '#0084ff', '#39539E', '#0077B5'],
labels: ['Vimeo', 'Messenger', 'Facebook', 'LinkedIn'],
}
let series = [{
name: 'series-1',
data: [30, 40, 45, 50, 49, 60, 70, 91]
}]
</script>